Board Game Data Explorer
 Photo by James Pond on Unsplash
Note: The Board Game Data Explorer is not currently actively maintained but is still hosted at https://boardgame-explorer.herokuapp.com/. As it is on the lowest Heroku tier, it takes time to initially load.
Motivation
The Board Game Data Explorer was built as part of the Master of Data Science (MDS) degree at UBC and was completed with Mitch Harris, Ryan Koenig, and Sophia Bulcock.
The data explorer app was completed over a short 2- to 3-week period and was built as part of a data visualization course. This project was selected as several team members are also board game enthusiasts (myself included). Our goal was to create an app that we could actually use as well as a side project to continue tinkering with. It was also a good opportunity to use a dimensionality reduction technique on non-numeric data to support data visualizations.
So far I’ve found the app to be quite useful for exploring board games that I might be interested in … although there’s improvements we’re considering.
The app can be found here and the code is available on github.
Data Source
The project uses board game data compiled from the BoardGameGeek website. BoardGameGeek is an online resource/community providing information on game features (game categories, mechanics, min/max playtime etc.) as well as user ratings for each game in the database.
The project was started using a dataset obtained from the R4DS TidyTuesday Github repository. This dataset had been cleaned to remove games published prior to 1950, missing a published year, or with less than 50 user ratings. This resulted in a dataset with approximately 10,000 board games. Unfortunately, the dataset ended in early 2016. As such, part of the project included getting the latest data directly from the BoardGameGeek API.
Features from the dataset selected for the app include:
- Category: Card Game, Horror, Space Exploration, etc
- Mechanic: Hand Management, Dice Rolling, Area Control, etc
- Publisher: Fantasy Flight Games, Milton Bradley, Awaken Realms, etc
- User Ratings:
- Average User Rating
- User Rating Count
- Published Year
The dataset in the app is updated on a regular basis using a series of scripts that queries the BoardGameGeek API, cleans the data, and performs analyses used by the app.
Application Overview / Example
The purpose of the app is to provide an interactive tool allowing a user to explore board game data. It currently includes the following functionality:
- Explore user rating trends in board game features.
- Provides the top 10 rated board games based on user selections of categories, mechanics, and/or publishers.
- Generates a 3D interactive graph of game similarity using t-SNE dimensionality reduction (and represents the most interesting feature of the app!)
The general idea of the app is that it allows a user to explore the level of detail they are interested in. A quick demo running through the app layout is shown below:
Each of these features are explained in the following section along with an example of how the app could be used. However, the best way to understand the functionality is just to explore the app.
Games Trends
The game trends tab allows a user to select single or multiple categories, mechanics, or publishers. The app then generates graphs showing user ratings and an annual count of games matching that criteria vs published year.
For example, if I am interested in exploring Horror and Space Exploration Games I could select these categories in the game trends tab. I also select games with more than 2,000 user ratings.
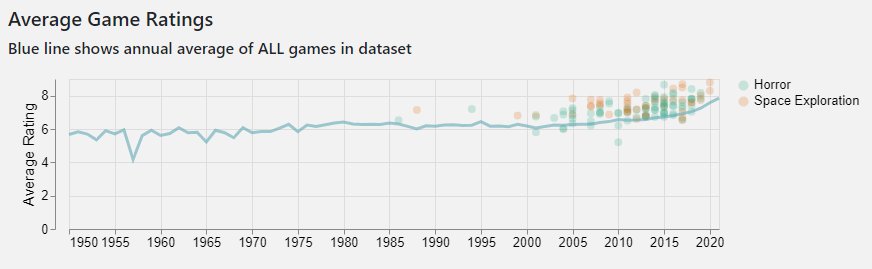
The user rating figure shows that both categories have games with high ratings. The app also provides a hover-over feature that allows us to see the game name associated with each data point.
Top 10 Games
The top games tab allows a user to filter games based on category, mechanic and/or publisher. A bar graph shows the top 10 games ranked by user rating.
If we continue with the example from the previous section, say I decide to explore Space Exploration games as there appears to be slightly higher rated games in that category. I am also interested in Hand Management games and will select that mechanic using the dropdown menu. Similar to before, I’ll use a minimum user rating count of 2,000.
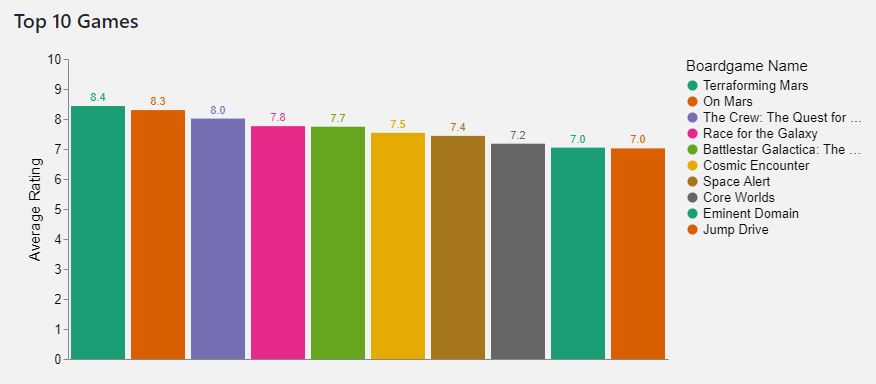
The bar chart shows that Terraforming Mars is the top rated game followed by On Mars and The Crew: The Quest for Planet Nine. I can also get a quick view on game details by looking at the Top 10 Games Facts Table available in the tab.
3D Game Explorer
The 3D Game explorer provides an interactive view of the board games in the dataset. The horizontal axes represents game categories and mechanics and the vertical axis represents user ratings. The graph was generated using a t-SNE dimensionality reduction described in the following section.
Now that I have a chosen a few top games in Space Exploration, I can use the 3D explorer to look at these games and see how they relate to other games I may be familiar with. I already own Terraforming Mars so I’ll look at On Mars and the The Crew: The Quest for Planet Nine. I’ll use the explorer to look at similar games to these and check if they’re of interest.
First I’ll select games in the Space Exploration category and highlight the game On Mars.
I can see that On Mars (highlighted in purple) is close to a very large cluster of games in the Space Exploration category. Clicking on points in the vicinity of On Mars identifies several games that I’m already familiar with such as Twilight Imperium and High Frontiers. This large cluster appears to be made up of games that include space empire/civilization building.
I’ll now select The Quest for Planet Nine and explore games in the vicinity.
The Quest for Planet Nine appears to be far away from On Mars on the 3D explorer indicating it’s a different type of game. Clicking on the highlighted point we can see it includes the Trick-taking mechanic. The graph shows a tight clustering of similar games if I select Trick-taking to subset on in the explorer. Clicking on games around the Quest for Planet Nine, the cluster appears to be made of Card Games with Hand Management, Trick-taking, and potentially Bluffing mechanics. As I’m more interested in civilization building games, I’ll likely look into On Mars instead.
This may seem like a contrived example but I have used this to explore new games of interest in using a very similar approach.
A description of the how the 3D Game Explorer is generated is provided below.
t-SNE Visualization
The 3D Game Explorer represents game position using t-distributed stochastic neighbour embedding (t-SNE). t-SNE is used for visualizing high-dimensional data in lower dimensions. The model tries to keep points that are similar to each other in the higher dimensional data close to each other in the lower dimensional representation. t-SNE is highly dependent on the parameters used in the method and an interactive discussion on this can be found here.
To use the model, one-hot encoding was used to create a new dataset with each column representing an individual category or mechanic. If a game has a particular category or mechanic, the corresponding column is marked with a 1; otherwise, the column is left blank. Every category or mechanic a game contains results in a column marked with a 1. Some of these marks will overlap with other games in the dataset while others will not. For example:
- Two identical games will have the same columns marked with 1s.
- Two completely dissimilar games will have no overlapping column marks.
- Two games that are somewhat similar will have some but not all overlapping columns with 1s.
t-SNE was then used on the one-hot encoded dataset (approximately 150 columns) to create to a two-dimensional category/mechanics representation of the games. These two dimensions are the horizontal (x and y axes) in the 3D Game Explorer.
An example of the horizontal representation with several categories highlighted in the app is shown below. The figure provides a top-down view of graph.
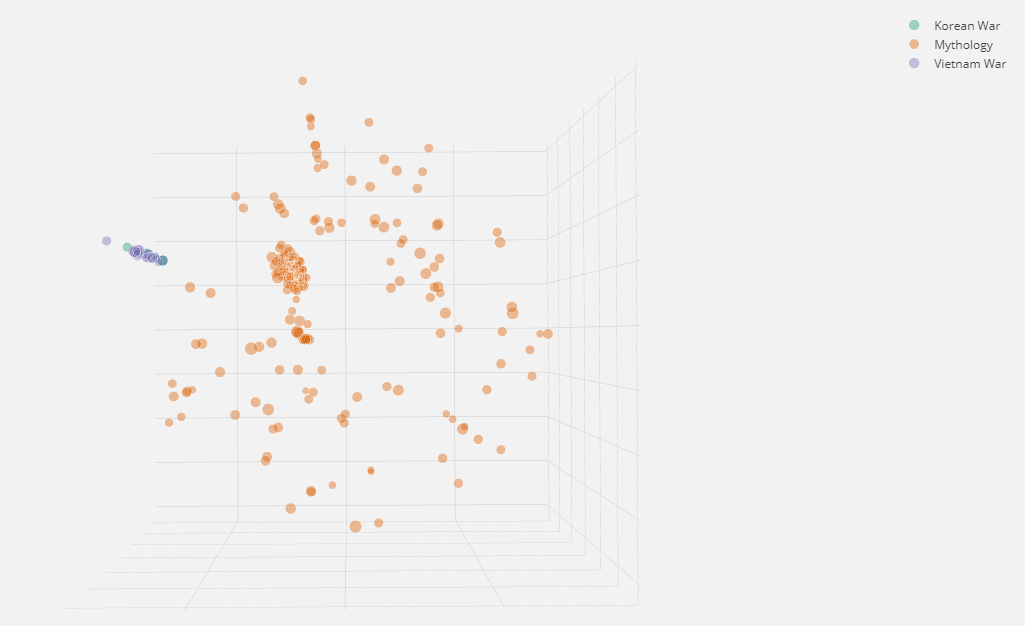
The figure shows that the Korean and Vietnam War categories (purple and green points) are clustered very close to each other whereas the Mythology category is diverse and has multiple clusters. Mythology also does not overlap with the Korean/Vietnam War cluster as would be expected.
A separate t-SNE model was then used on the the average user rating and count of user ratings to create a single dimension and is the vertical (z axis) in the 3D Game Explorer. This is not a high dimensional reduction (only going from two to one) and a different method could have been used to combine the user rating features. However, the t-SNE model was found to provide reasonable results.
The resulting 3D representation of board games is surprisingly good having used the app to look at many of the games in my collection. As another example, if you search for Monopoly you’ll find a tight clustering of many low rated games.
Future Work
The Board Game Data Explorer was fun to work on and resulted in an app that I’ve found interesting to use. It was developed over a short period of time and there are additional improvement we still plan to work on including:
- Improving several of the figures in the game trends tab.
- Adding additional and uniform filtering capability for each tab in the app.
- Automating the dataset updating process which currently uses a manual trigger in GitHub Actions.
- Improving several layout features to scale better on different browsers.
More details on planned improvements can be found here and also includes a list of bugs found since using the app.
Please feel free to try the out the app if it’s of interest. If you find any bugs or have suggested improvements, just add them to the GitHub list!
Nathan Smith
Data Scientist
Solving problems using data science coupled with a background in water resource engineering.